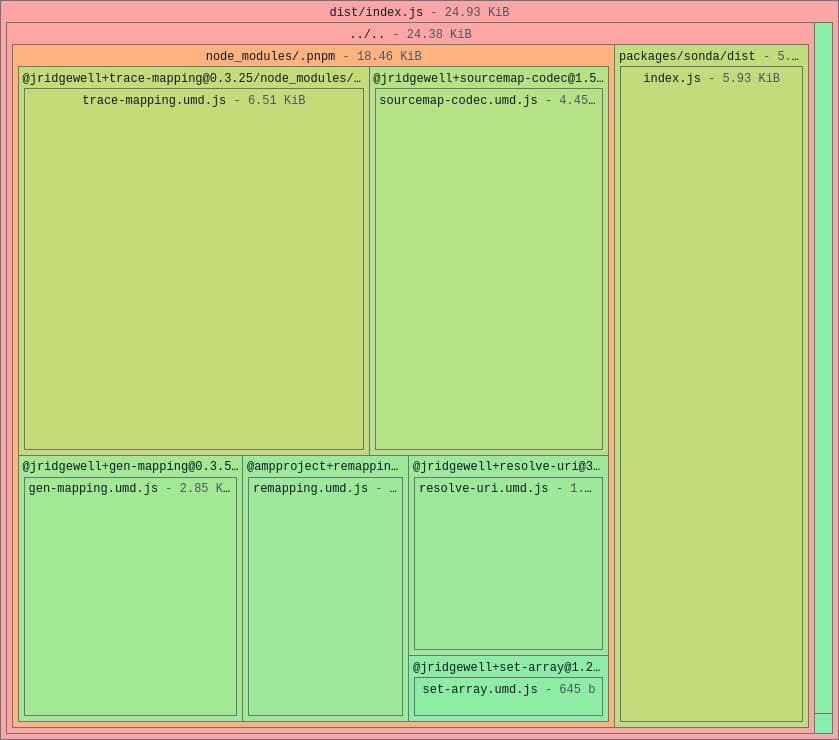
Treemap Chart
The Treemap page visualizes the sizes of your build's assets and their contents relative to each other. By default, it shows a treemap for the entire build, with each tile representing an output asset or a folder.

Clicking on a folder tile zooms into that folder's contents. Clicking on an asset tile drills down to a treemap of its source files, where each tile represents a single source file. Finally, clicking on a source file tile opens a detail view showing its file type, size, origin, and other metadata.
This workflow helps you quickly identify the largest assets and explore how individual files contribute to your build size.
Reading the Treemap
The size and color of each tile is proportional to the file or folder size. Larger and warmer (redder) colors indicate larger sizes. The actual size of the file or folder is displayed next to its name and reflects the currently selected compression option (Uncompressed, GZIP, or Brotli). By default, the tree map shows uncompressed sizes.

The [unassigned] Tile
A [unassigned] tile represents bundle content that couldn't be mapped to a specific source file, typically including:
- Comments
- Code injected by the bundler at build time
- Plugin-generated code without proper source-map support
If you see a large [unassigned] tile, consider investigating its origin using a tool like the Source Map Visualizer.
